Examples

Real dashboards, not mock-ups.

These screens come from our reference environment. The company is fictional and the data is sample data, shaped like the data of a real ERP system.

Yours will look different: we build each dashboard with the people who use it. Select a screen to see it full size.

Sales

What was sold, at what margin, and was it delivered?

  • Net sales, margin, returns and open backlog on one screen
  • Trends by channel, country, category and brand
  • On time and in full: where deliveries slip, and why
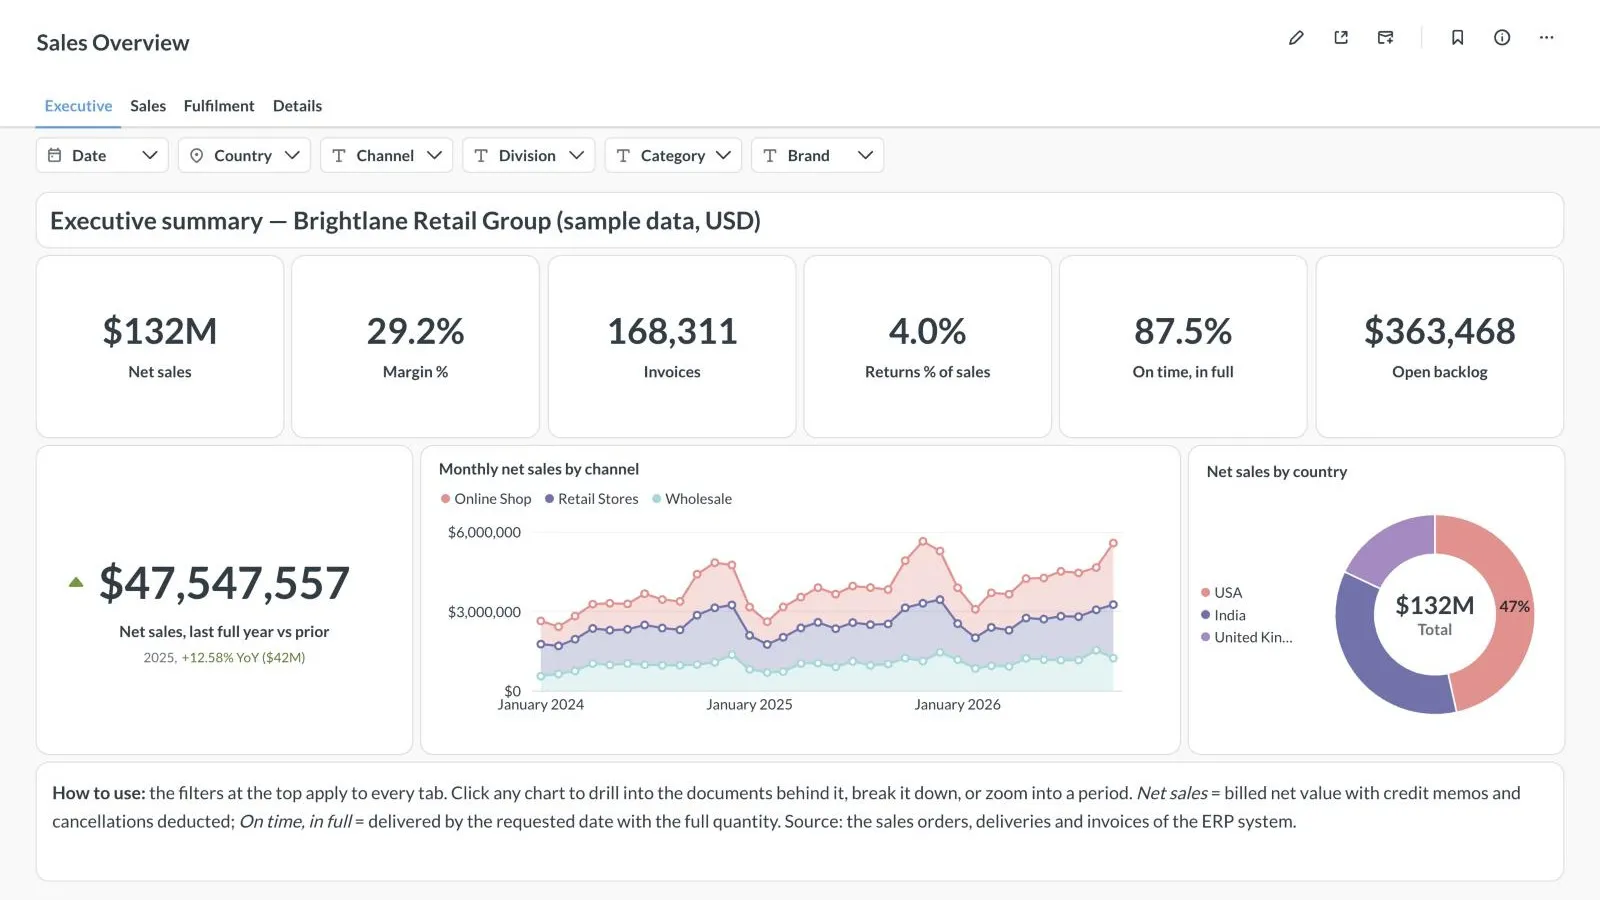
Sales executive dashboard: net sales, margin, invoices, returns, on time in full and open backlog, with monthly sales by channel
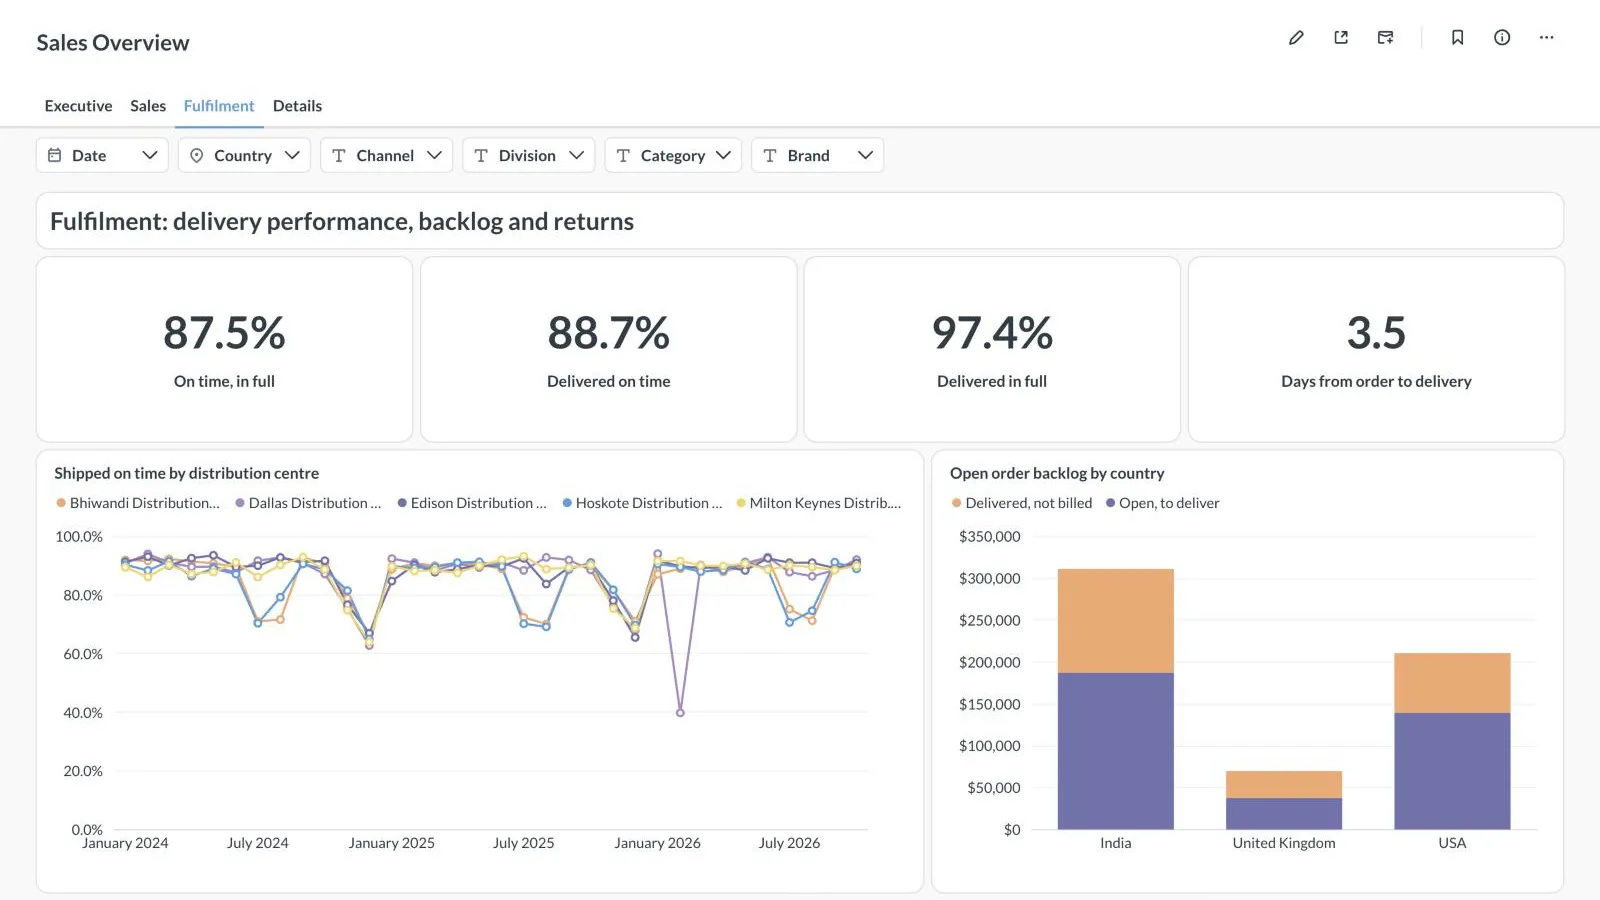
Sales fulfillment dashboard: deliveries on time and in full, by distribution center, with return and rejection reasons

Procurement

What do we spend, with whom, and do they deliver?

  • Spend, price variance and the share bought on contract
  • Vendors on time and in full, and the least punctual ones
  • Open orders by planned delivery month
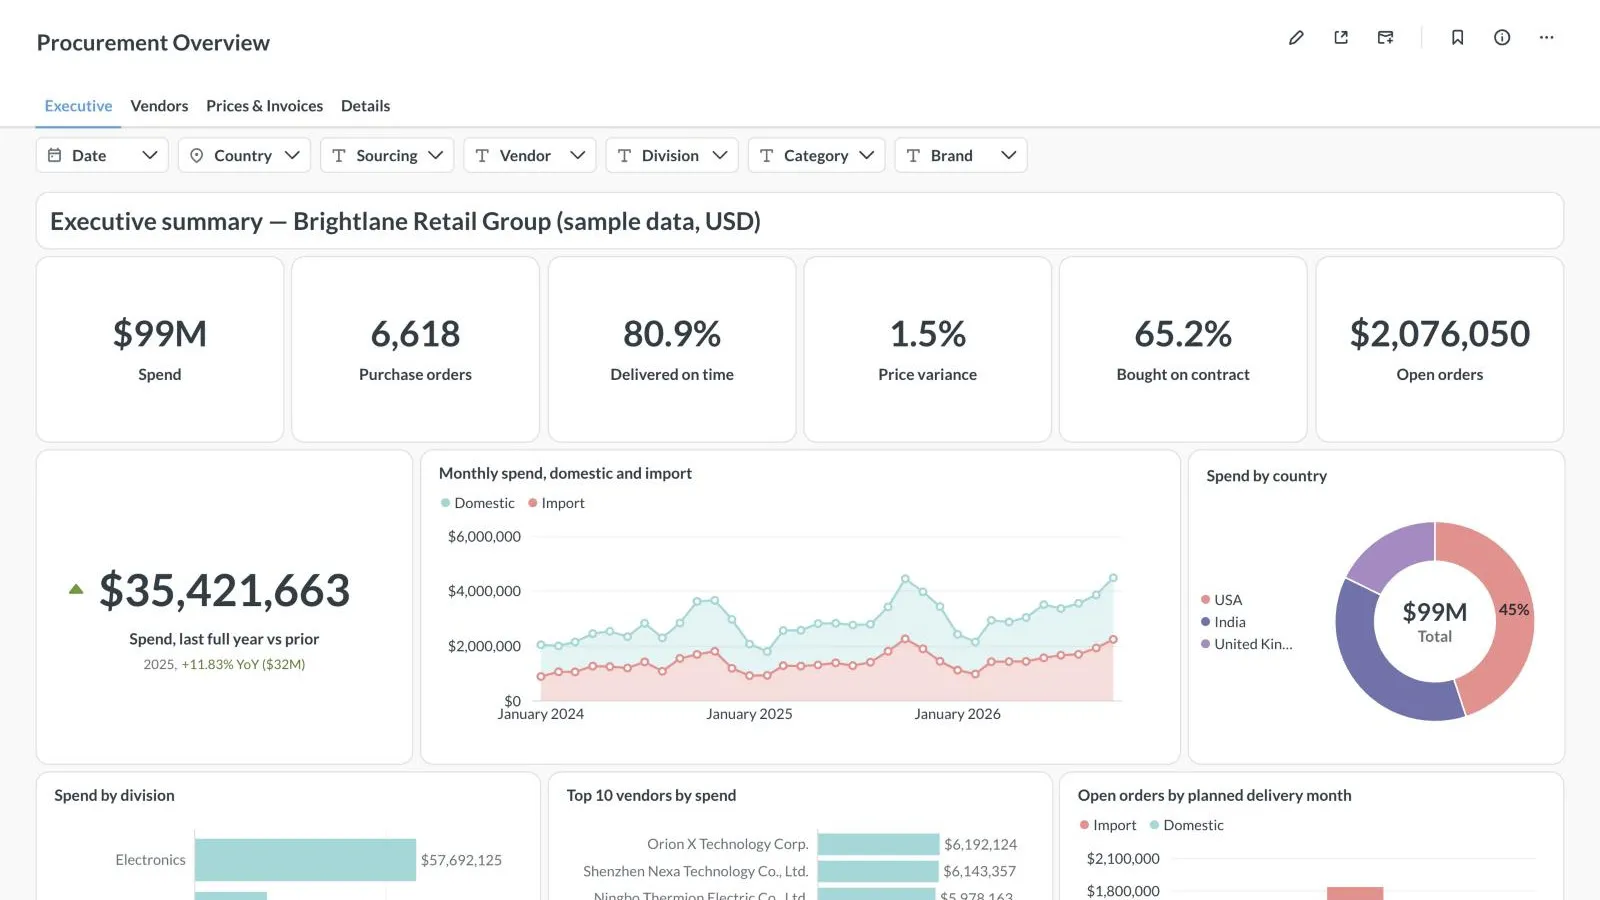
Procurement executive dashboard: spend, purchase orders, deliveries on time, price variance and open orders
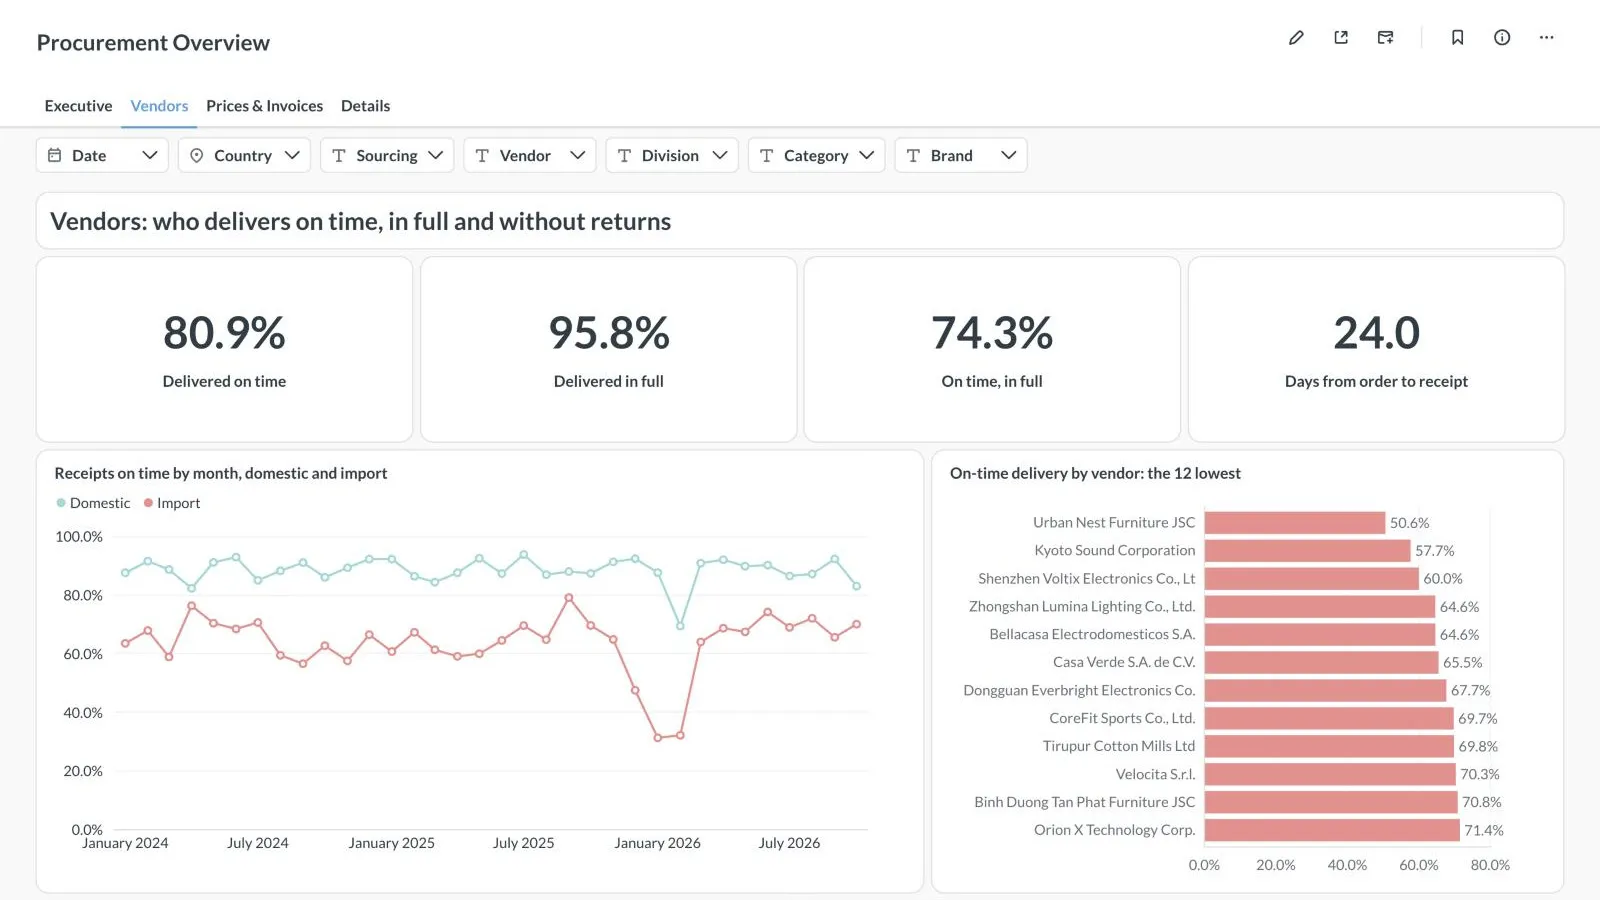
Vendor dashboard: deliveries on time and in full by month and by distribution center, and the least punctual vendors

Inventory

What is in stock, what is it worth, and what is not moving?

  • Stock value and days of cover, by plant and division
  • Items out of stock and slow-moving stock
  • Losses at stock counts and stores replenished on time
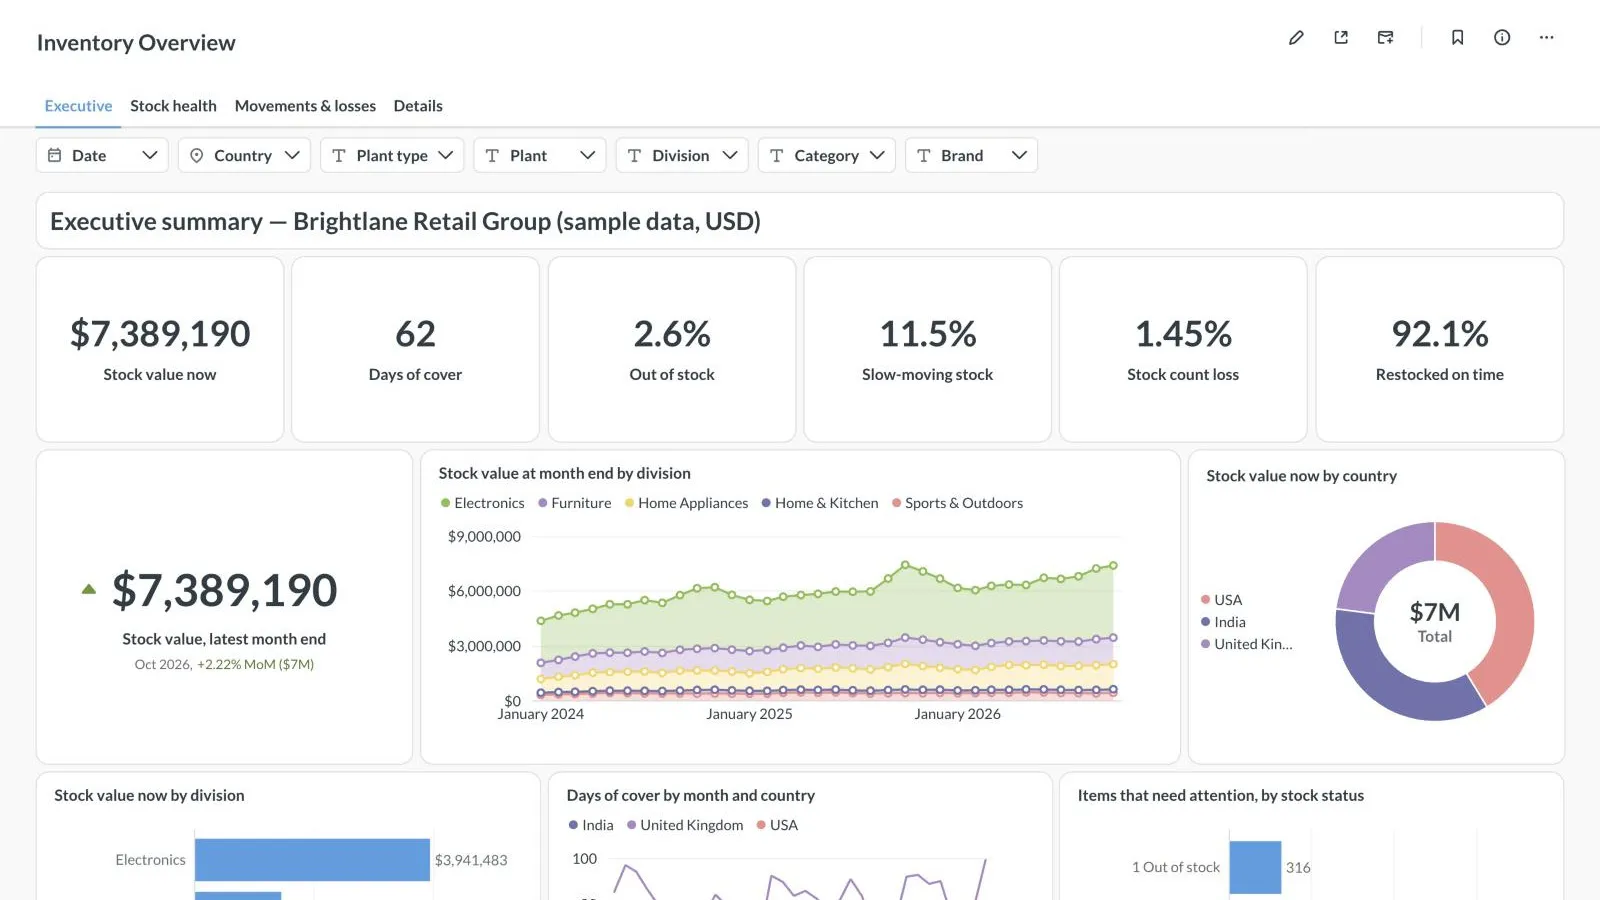
Inventory executive dashboard: stock value, days of cover, items out of stock and slow-moving stock
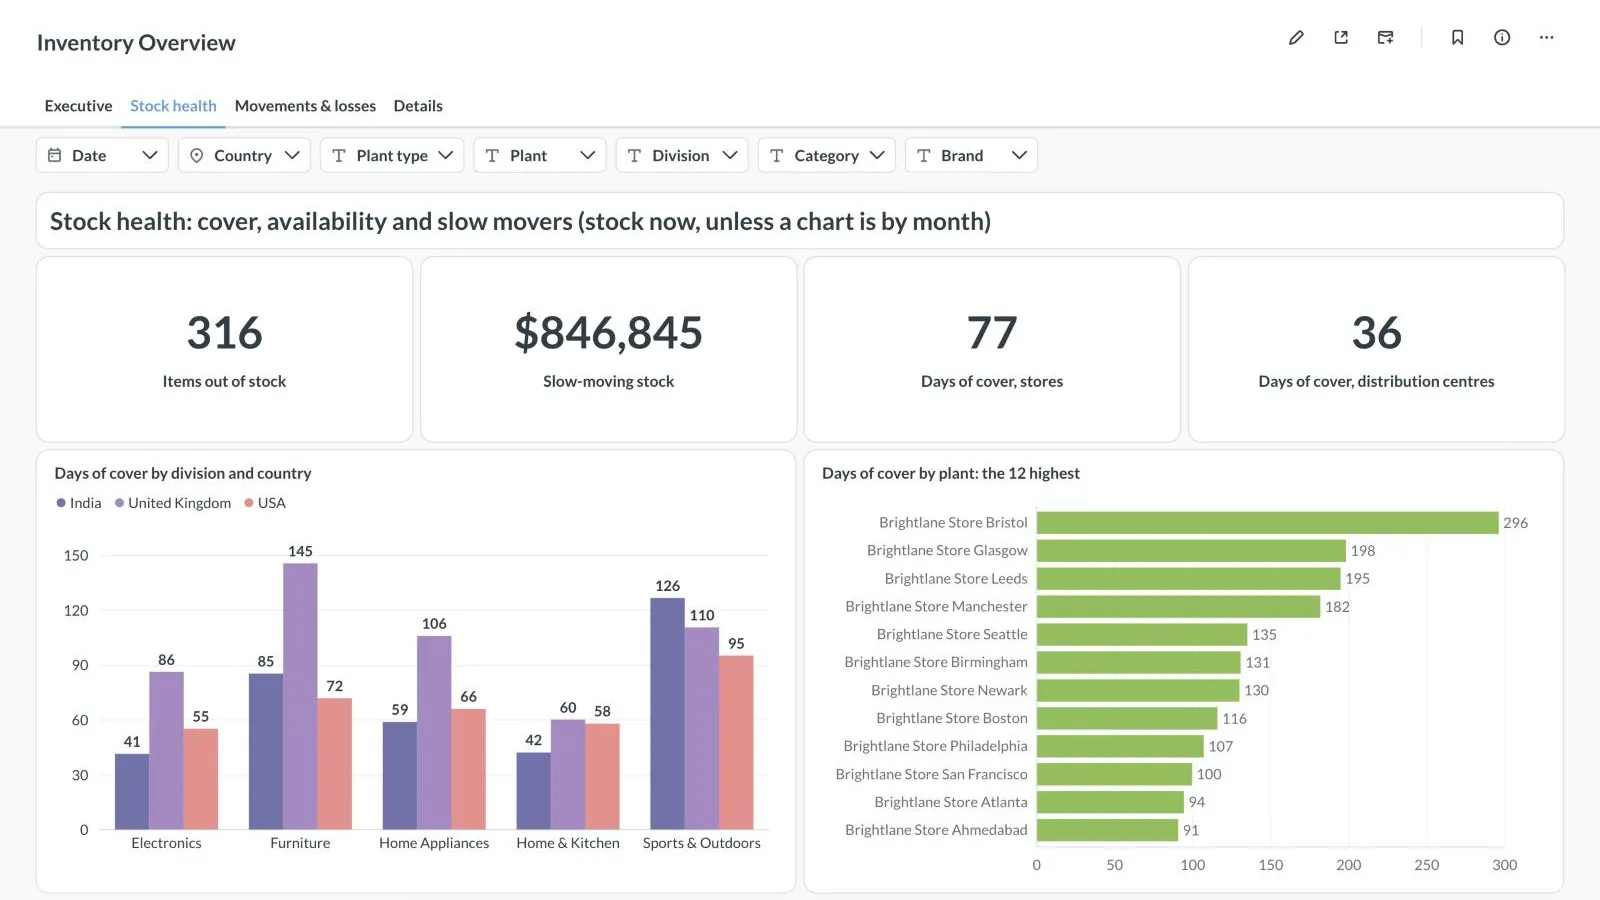
Stock health dashboard: cover by division, country and plant, items out of stock by month and slow-moving stock

Across areas

Buying, stock and sales on one set of numbers.

  • Margin after what purchasing actually paid
  • Days of inventory, from stock and sales together
  • On time across suppliers, stores and customers
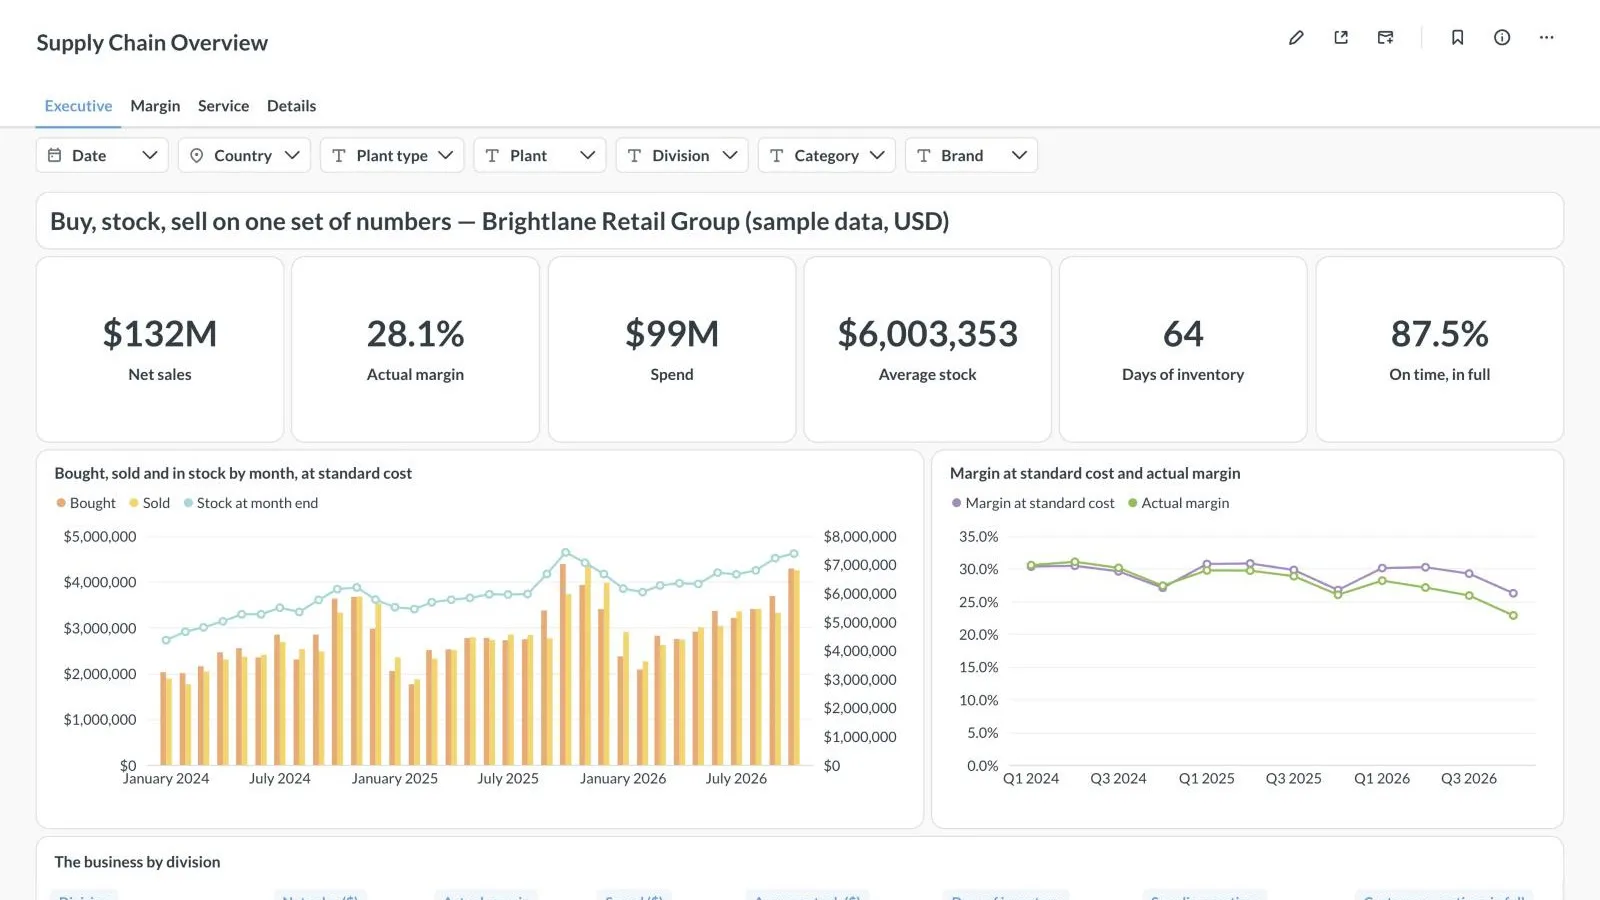
Supply chain dashboard: net sales, actual margin, spend, stock and days of inventory in one view
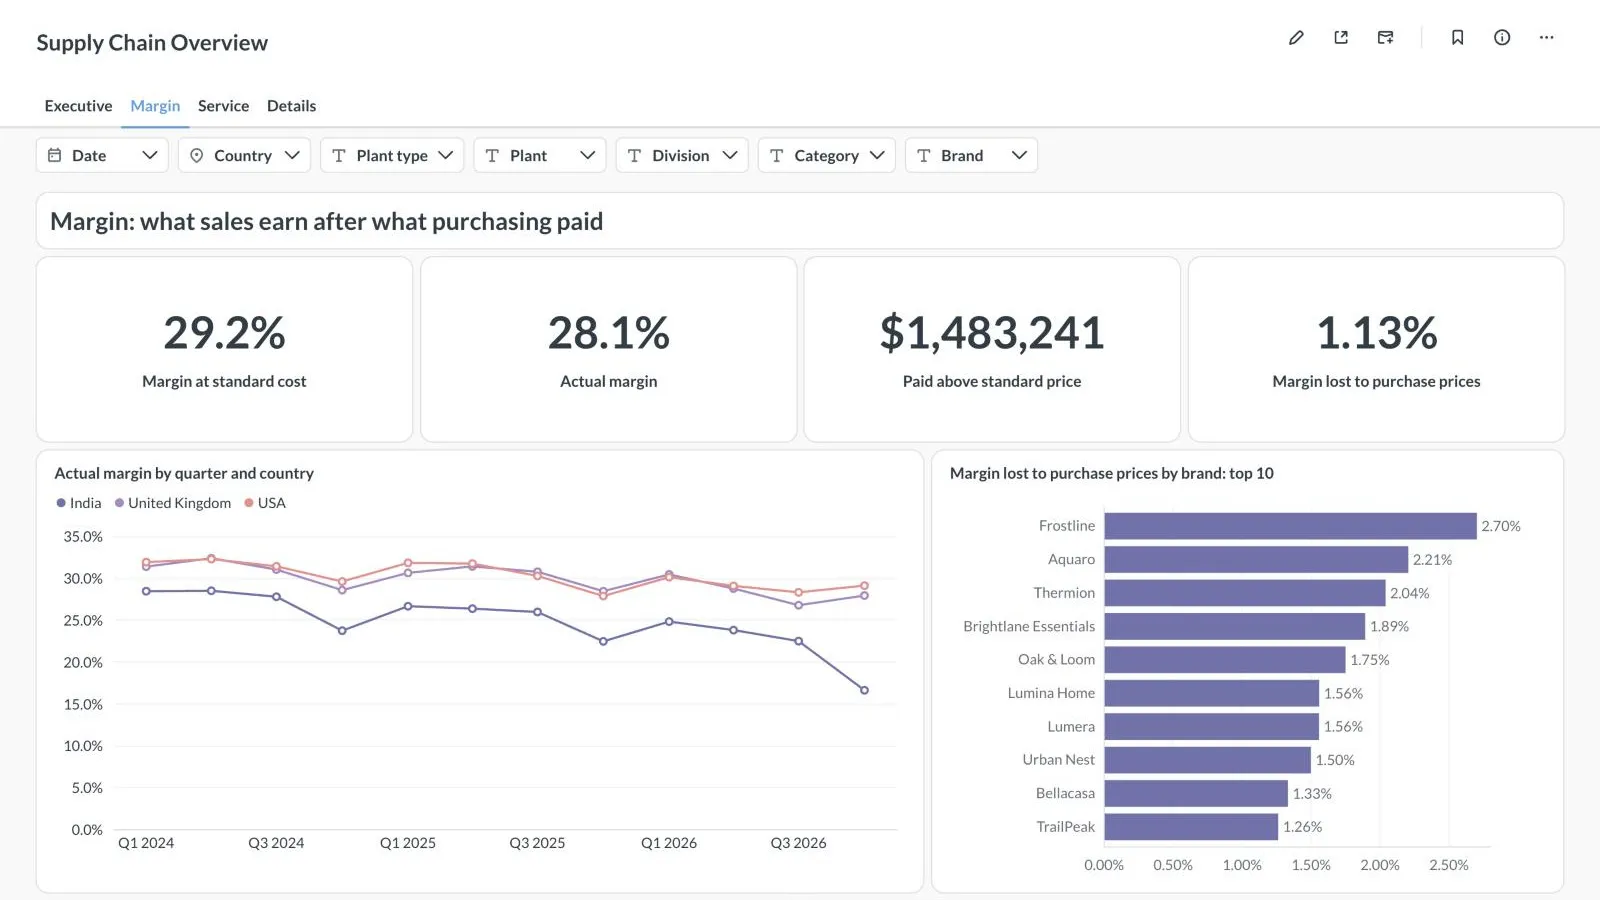
Margin dashboard: margin at standard cost against actual margin, by quarter, country and brand

Business areas

Any area that runs on numbers.

You choose where to start.

  • Finance
  • Sales
  • Procurement
  • Inventory
  • Production
  • Service
  • and others

Where the data comes from

  • ERP systems, such as SAP
  • CRM systems
  • Finance and accounting systems
  • Databases
  • Spreadsheets and files

Tell us what you want to see on one screen.

Thirty minutes is enough to tell you which option fits and what it would cost per month.